
Published by: Mandira
Published date: 28 Jan 2022
The arrangement of the population on the basis of the social, economic, and characterise like, occupation, age, religion, sex etc. is known as population composition. It is also known as the structure of the population. We can see there are different people inside the earth. Some may be rich and some may be poor some may be old and some may be young. The composition of the population helps to find out the structures of the population on the basis of their socio-economic and the demographic characteristics.
Composition of population by occupation
People do different types of jobs or works in order to earn their living. The arrangement of the population on the basis of occupation is known as population composition by occupation.
Population Composition by Sex
Male and female, both, are the two very important part of society. In the society, we can see either female or male. So, the arrangement of a population on the basis of sex is known as population composition by sex. The following table shows the sex composition according to the census of 2011 AD:
| Sex | Population | Percentage |
| Male | 12,849,041 | 48.50 |
| Female | 13,645,463 | 51.50 |
| Total | 26,494,504 | 100 |
The above table shows that the population of the female is more than that of the male. The percentage of the female is greater than the male population.
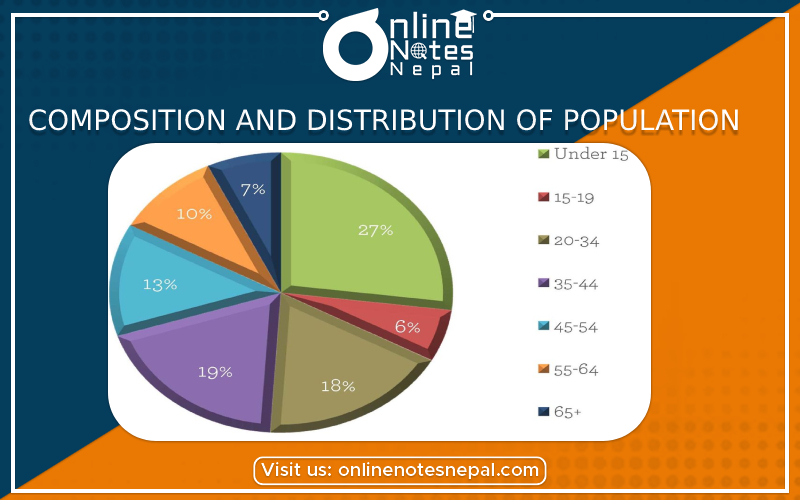
Population Composition by Age
The composition of the population by the age of the people living in the country is known as population composition by age or the arrangement of the population on the basis of their different age group is also known as population composition by age. The population composition by age can be shown with the help of various age groups. They can be shown by single year age group, broad age or five year age groups. Like the age group 0 to 14 years, 15 to 59 years and 60 years and above 60. The population of the age group of 0-14 years and above 60 are known as dependent population whereas the age group 15-59 are known the active population.
Composition of Population by Caste/Ethnic Group
There are 126 castes in our country Nepal . Like Rai, Lama, Tamang, Sherpa, Magar etc are the castes living in our country. The arrangement of the population on the basis of the caste/ethnic group is called composition of the population by caste/ethnicity. The following table shows the composition according to the census of 2011 AD:
| Caste | population | percentage |
| Chhetri | 4,398,053 | 16.6 |
| Brahman | 3,226,903 | 12.2 |
| Magar | 1,887,733 | 7.1 |
| Tharu | 1,737,470 | 6.6 |
| Tamang | 1,539,830 | 5.8 |
| Newar | 1,321,933 | 5 |
| Kami | 1,258,554 | 4.8 |
| Musalman | 1,164,255 | 4.4 |
| Yadav | 1,054,458 | 4 |
| Rai | 620,004 | 2.3 |
Introduction to Population Distribution
The arrangement of the population according to their geographical and administrative region is known as Population Distribution. In our country, Nepal the distribution of a population is different according to the place and time. The population distribution by a geographical and administrative division is not found equal in a context of our country. Nowadays in the place where we can find the facilities like education, transportation, communication etc. is more populated or densely populated and the place where there is a lack of these facilities are sparsely populated or have fewer people. The people from village area move to the city areas to have a better facilities.
Distribution of Population based on Geographical region
Our country Nepal is divided into three regions as Mountain, Hill and Terai regions. Different region has its own physical features, land topography, and climatic condition also. In some region, it is very cold and in some region, it is very hot and in some region, it is neither hot nor cold. It is found that the population of Terai region is very high in comparison to other regions. The distribution of population according to the geographical region is given below ;
| Area | Population | Percentage |
| Mountain | 1,795,354 | 6.73 |
| Hill | 11,475,001 | 43 |
| Terai | 13,350,545 | 50.27 |
| Total | 26,494,504 | 100 |
The above table shows that 6.67% people live in mountain region and 43% people live in the hilly region and 50.27% of people live in Terai region. It shows that there are very few people in the mountain region and almost half of the total population of the country is living in the Terai regionas there are many facilities and servicesin the Terai region.