
Published by: Mandira
Published date: 13 Jan 2022
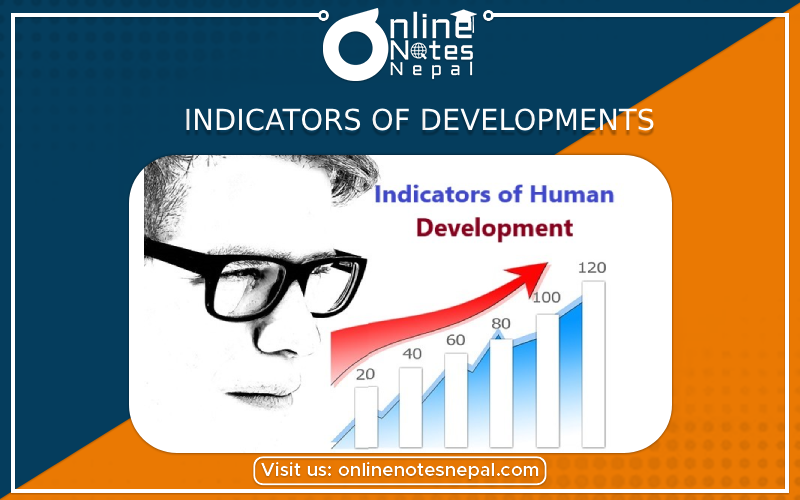
Development indicators show the progress that has been made in a particular area, such as health education or gender equality . Indicators of development help to find out the progress of a country . According to UNDP, there are three essentials of development , which include the ability to lead a long and healthy life , to acquire knowledge and , to have a decent standard of life. When people fulfill their basic need that is their first decision of the development of the country . After their basic need all the people they think about the things like security, love , self-respect etc. The fulfillment of this types of needs is said to an indicator of development . There different types of indicators of development . They are as followed :
Quality of life
The quality of life is the life where there is the fulfillment of every basic need of the people . In the world, every person or every people they need their perfect life where they can have the things which they need or want . Always the need and the demand of the people goes on increasing . No one is happy with their life .When rich people are not satisfied with their life , the poor people who are passing through the hardship of the life may be living with smile and hopes . So ,the quality of life is a complete related term used for comfort which has both physical , social , economical and psychological of human beings.
Following are the things people should get to improve the quality of life or to developed the nation or society :
Basic Need Oriented Approach
Fulfillment of basic need was considered as one of the indicators of economic development since from the 1970s. Comparison of quality of life is basic need approach.
According to the basic needs of Nepal Government approach , basic need include the fulfillment of the following things :
Physical Quality of Life Index (PQLI)
The PQLI was introduced by the sociologist ,Morris D Morris on 1970 AD. The rank of physical quality of life index is based on the following indicators:
PQLI is a means to measure the quality of life of the people living together in the given place or country. The physical quality of life index ranges from zero to 100 . The higher the value is found the more a country is considered with people of the high quality of life.The physical quality of life index focuses on providing health , education , and social security .
Human Development Index
Human development is index approach is used by UNDP. The concept of Human Development Index was developed in 1990 AD by Pakistani economist Dr. Mahbub UIHaq and Indian economistDr. Amartya San.
Following are the indicators of the indicators of the index:
An index consists of the base of those three indicators. The index ranges from zero to one. Zero show the lowest level of quality of life and highest and optimum level is represented by 1. The country with low HID score called the country with the poor quality of life .
According to recent provision of new methodology the HID is categorized into four level such as:
| Level of Human Development | HID Score |
| Very High Human Development | 0.781-1.00 |
| High Human Development | 0.698-0.780 |
| Medium Human Development | 0.520-0.697 |
| Low Human Development | 0.00-0.510 |
From 1990AD the UNDP has been continuously publishing annual HDI report. During 2006 AD Nepal attained 138 ranks with the score of 0.527. Likewise, on 2011 AD Nepal was placed on 157 ranks with the score of 0.4 58 out the 187 countries and again in 2013 AD 157 position with the score of 0.463 amongst the 185 countries.
The status of Nepal in HID is given by the table below :
Table : The HID Status of Nepal , 2004-2015 AD
| Year | Rank | Score |
| 2004 | 140th | 0.504 |
| 2006 | 138th | 0.527 |
| 2011 | 157th | 0.458 |
| 2013 | 157th | 0.463 |
| 2015 | 145th | 0.548 |
Table : Human Development Index of SAARC Countries , 2013 and 2015 AD
HDI Rank |
Country | HDI Score |
||
| 2013 | 2015 | 2013 | 2015 | |
| 92nd | 73rd | Sir Lanka | 0.751 | 0.757 |
| 104th | 104th | Maldives | 0.688 | 0.706 |
| 136th | 130th | India | 0.554 | 0.609 |
| 140th | 132nd | Bhutan | 0.538 | 0.605 |
| 146th | 142nd | Bangladesh | 0.515 | 0.570 |
| 146th | 147th | Pakistan | 0.515 | 0.538 |
| 157th | 145th | Nepal | 0.463 | 0.548 |
| 175th | 171st | Afghanistan | 0.374 | 0.465 |
For the top ten HDI Countries for the year of 2013 AD are described by the following table:
Table : Human Development Index of the top 10 Countries in the World, 2015 AD.
| SN | HID Rank | Countries | HID Score |
| 1 | 1st | Norway | 0.944 |
| 2 | 2nd | Australia | 0.935 |
| 3 | 3rd | switzerland | 0.930 |
| 4 | 4th | Denmark | 0.323 |
| 5 | 5th | Neherlands | 0.922 |
| 6 | 6th | Germany | 0.916 |
| 7 | 7th | Ireland | 0.916 |
| 8 | 8th | USA | 0.915 |
| 9 | 9th | Canada | 0.913 |
| 10 | 10th | New Zealand | 0.913 |
Table : Human Development Index of the lowest 10 countries in the world , 2015 AD.
| SN | Rank | Country | HDI Score |
| 1 | 179th | Mali | 0.419 |
| 2 | 180th | Mozambique | 0.416 |
| 3 | 181th | Sierra Leone | 0.413 |
| 4 | 182th | Guinea | 0.411 |
| 5 | 183th | Burkina Faso | 0.402 |
| 6 | 184th | Burundi | 0.400 |
| 7 | 185th | Chad | 0.392 |
| 8 | 186th | Eritrea | 0.391 |
| 9 | 187th | Central African Republica | 0.350 |
| 10 | 188th | Niger | 0.348 |
Following things should be given to maintaining the quality of life:
Happiness : The overall satisfaction of the life is known as happiness. In the world, if all people will be happy then whole nation will be happy. Happiness is the main means of development because if a country will develop then people they can get whatever they need or want. Happiness can be obtained through the fulfilment of basic need ,social security ,individual and family satisfaction . There are mainly seven types of domains which are considered as positive or negative infrastructure of development;
Table : Happiness Status of the SAARC Countries, 2016 AD.
| Rank | Countries | Score |
| 84th | Bhutan | 5.196 |
| 92nd | Pakistan | 5.132 |
| 107th | Nepal | 4.793 |
| 110th | Bangladesh | 4.643 |
| 117th | Srilanka | 4.415 |
| 118th | India | 4.404 |
| 154th | Afgianistan | 3.360 |
| ------ | Maldives | ------- |
Table : Distribution of Municipalities according to their classification, 2014 AD
| SN | Category | Number |
| 1 | Metropolis | 1 |
| 2 | Sub- metropolis | 11 |
| 3 | Municipality | 118 |
| 4 | Total mUNICIPALITIES | 130 |