Published by: sadikshya
Published date: 02 Jul 2021

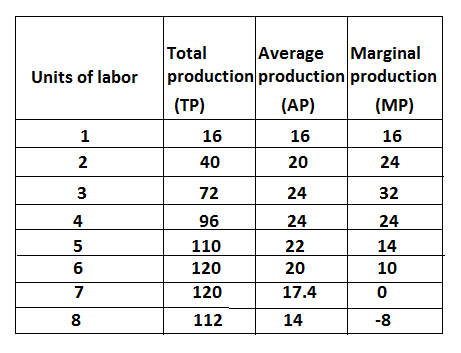
Relation between total, average and marginal products can be illustrated with the help of the following hypothetical table. Here the land is a fixed factor and labour is a variables factor of production.

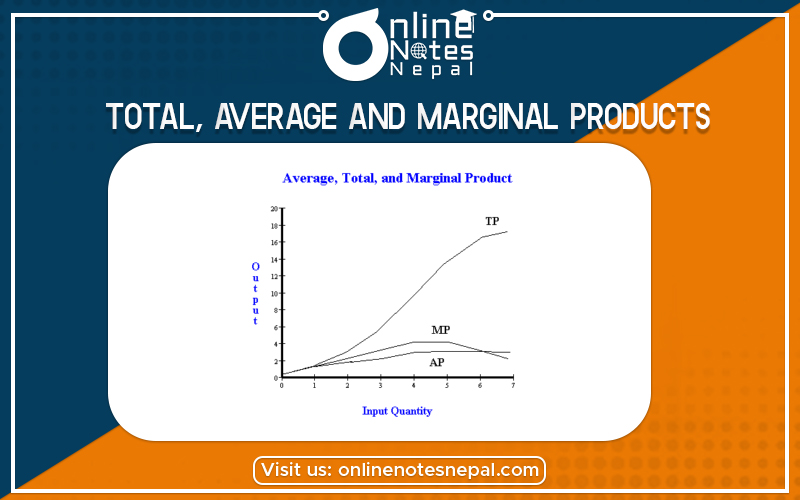
The above table shows the relationship between total production, average production, and marginal production.
It increases the beginning reaches at the maximum point when marginal production is zero and starts to fall as marginal production becomes negative.
It increases but slower the marginal product reaches as the maximum point when the marginal point equal to the average product and starts to fall.
It increases faster than the average product reaches as the maximum point and stat to fall become zero and even negative.
Production function expresses the technology or mathematical relationship quantity of physical inputs and output. In other words, it shows with a given state of technological knowledge and during a particular period of time how much can be produced with a given amount of input. According to Stigler “production function is a relationship between inputs productive services per unit of time and output of product per unit of time. Thus we can calculate that production function is the technical relationship between the quantity of goods production and the factor of production necessary to produce it”. It may be express in the form of the equation.
X=F (LD, L, C, M, T)