
Published by: sadikshya
Published date: 28 Jun 2021
Derivation of the individual supply curve also refers to a single producer supply. Single producer supply refers to the supply made by a firm and producer at different levels of price of the commodities. It depends upon the cost of production and the expected price of goods. Because this is different between one another due to the cost difference of goods, the seller will offer goods at different prices.
This can be shown in the following table.
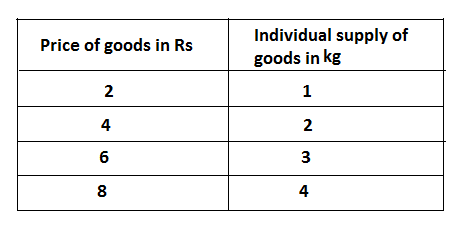
The above table shows that as the price of the commodity rises from Rs 2 to Rs 8. The quantity supply also increases from 1 to 4 kg. This means a seller gain more profit at a higher price and less profit at a lower price. It can be shown by the following diagram:
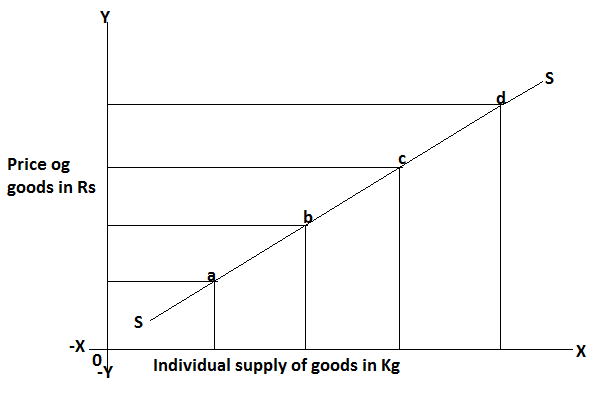
In this figure, the OX axis indicates individual quantity supply and the OY axis indicates the price of goods. When the price increases from Rs 2 to Rs 8 the quantity supply also increases from 1 kg to 4 kg, by joining the different combinations of price and quantity supply that is a, b, c, and d. we get a single producer supply curve SS which has a positive slope.