Published by: sadikshya
Published date: 28 Jun 2021

The quantity demand to buy an individual purchase at a given price is known as individual demand. An individual demand curve can be expanded with the help of the individual demand schedule and demand curve. The demand schedule shows the relation between quantities of commodities demands by the consumers at a given price level. An individual demand schedule is presented below.
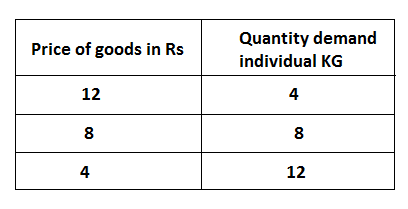
In the above table, the consumer wants to demand four kg when the price of commodities is Rs 12. If the price of commodities falls to Rs 8 then he/she demand 8 kg, Likewise which the price of commodities Rs four he demand 12 kg. This can be further explained by the following diagram.
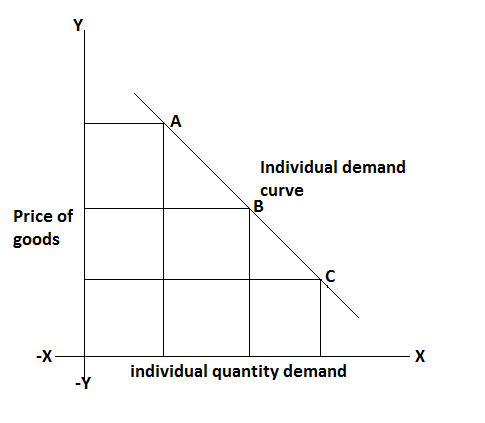
In the above diagram, the individual demand curve is denoted by (DD) which slopes downward from left to the right. It shows the inverse relationship between price and quantity demand.
The total quantity demand by all consumers of a market together is known as market demand. The market demand is the total demand for a commodity that can be calculated. Big adding the quantity demand by all the consumer suppose two consumer A and B they are in a market and purchase X goods. The market demand will be calculated as follows.
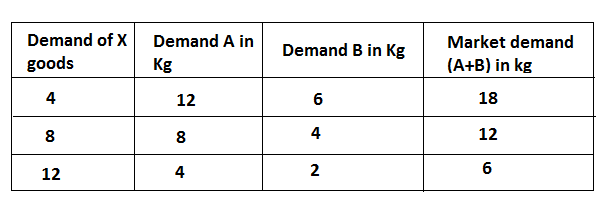
In the above table, when the price of X goods is Rs four demand of A 12 kg and B 6 kg and marked demand 12+6=18 kg. If the price of X goods increases of Rs 8 and Rs 12 the demand for goods decreases of 8kg and four kg of A four kg and 2 kg of B and market demand A+B decrease to will be 12 kg. The derivation of the market demand curve with the help of the market demand schedule is given below.
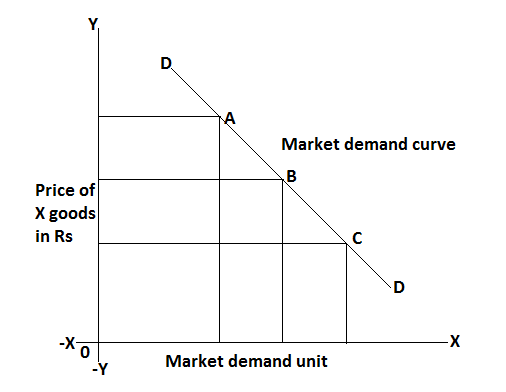
In the above figure, the market demand curve is denoted by DD which also slopes downward from left to the right in the figure the market demand curve DD is the summation of the individual demand curve, A and B the market demand curve also shows inverse relationship price and quantity demand.