Published by: sadikshya
Published date: 02 Jul 2021

When there is a change in supply due to factors than the price of the commodity, it is known as an increase or decrease in supply. It seems drawing a supply curve to the right or left of the original supply curve shows a change in supply. So it is called a shift in the supply curve. A shift in the SC is two types.
When due to change in factors other than price more quantity supply, it is known as an increase in supply. In this case, there will be a rightward shift of the supply curve that is the initial SC shift to the new rightward SC.
When due to change in factors other than price smaller quantity supply, it is known as a decrease in supply. In this case, there will be a leftward shifted in the supply curve.
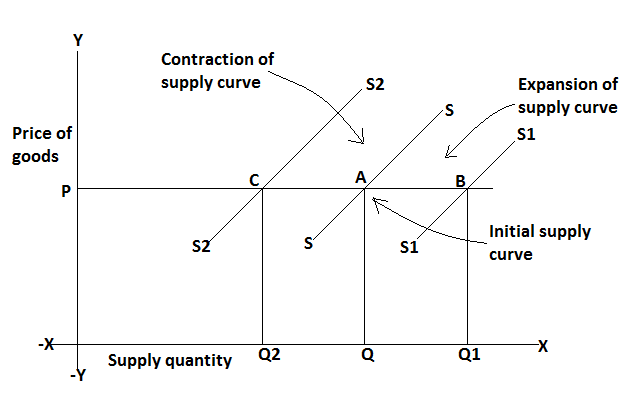
A shift in the SC can be explained with the help of the following figure.

In this figure, SS is the initial supply curve and point A is the initial equilibrium point price is OP and quantity supply is OQ. At the same price OP when the quantity supply increase from OQ to OQ1 due to change in other factors initial SC shift to the right as S1S1 similarly at the same price OP when the quantity supply decrease OQ to OQ2 initial SC shift to the left as S2S2.