Published by: Dikshya
Published date: 04 Sep 2023
POKHARA UNIVERSITY
Level: Bachelor Semester: Spring Year: 2023
Programme: BBA/BI/TT/BCIS/BHCM/BHM Full Marks: 100
Course: Data Analysis and Modeling Pass Marks: 45
Time: 3 hrs.
Candidates are required to answer in their own words as far as practicable The figures in the margin indicate full marks.
Section "A"
Very Short Answer Questions
Attempt all the questions. [10 * 2]
1. If SST = 90 and SSR = 70, compute the coefficient of determination and interpret its Meaning.
2. Interpret the regression coefficient of regression model y = 2 + 3x what is the estimated value when x =2?
3. For a set of 8 data points, the sum of squared differences between observed values and estimated values of y is 35.72, what is the standard error of estimate?
4. Given information from a multiple regression analysis, if n = 25 , b1 = 5 b2 = 10 ,sb1 = 2, sb2 = 8. Setup a 90% confidence interval estimate of the population slope ₂.
5. Using 2010 as the base year, compute the price index number for 2015 by using weight aggregates index method.
|
Product |
A |
B |
C |
D |
E |
|
2010 price(Rs) |
27 |
32 |
290 |
60 |
21 |
|
2015 price (Rs) |
52 |
51 |
314 |
76 |
86 |
6. What are the components of time series?
7. Demand for a certain commodity was 300 units in June, 60 in July and 160 inAugust. The forecast for June was 110 units with a smoothing constant of 0.30,what will be the September forecast.
8. What is the main objective of the Assignment model? Differentiate between balanced and unbalanced assignment models.
9. Find the active and inactive constraints of following LP. Max profit z = 9X + 7Y.
Subject to,
2X + Y <= 40
X + 3Y <= 30
X, Y >= 0
where optimal profit z = 750 at X = 18 and Y = 410.
10. What is the role of dummy activity in a network model? Draw a network diagram for the following project.
|
Activities |
A |
C |
D |
E |
|
Predecessors |
- |
- |
A.B |
B |
Section "B"
Descriptive Answer Questions
Attempt any six questions. [6*10]
11. The income and expenditure of 10 families is given below.
|
Expenditure $ |
5 |
10 |
15 |
20 |
25 |
30 |
35 |
40 |
45 |
|
Income $ |
20 |
25 |
30 |
30 |
30 |
40 |
50 |
50 |
70 |
a) Fit the regression equation of expenditure in income, Estimate the expenditure of family having income $65.
b) Compute coefficient of correlation between income and expenditure and test the significance of correlation coefficient at 5% level of significance.
12. "Fisher's Index number is called an economic barometer". Why? From the following data show that fisher's ideal index number satisfies both the time reversal test and factor reversal test.
|
Commodity |
2011 |
2012 |
||
|---|---|---|---|---|
|
Price |
Expenditure |
Price |
Expenditure |
|
|
P |
10 |
200 |
12 |
180 |
|
Q |
12 |
144 |
15 |
300 |
|
R |
8 |
80 |
8 |
96 |
|
S |
20 |
300 |
12 |
432 |
13. The following table shows the population of a city for seven years.
|
Year |
2016 |
2017 |
2018 |
2019 |
2020 |
2021 |
2022 |
|
Population (million) |
23 |
24 |
28 |
31 |
33 |
35 |
38 |
a) Find the trend line that best describes the data.
b) Find the monthly growth rate.
c) Calculate the trend values for different years.
d) Find the percentage of trend for the population of the city.
e) Find the relative cyclic residual for the population of the city.
f) In which year does the largest and smallest fluctuation from trend occur, and is it the same for both methods.
14. a) From the given information, calculate forecast for year 2015 using a=0.1 and forecast for year 2012 was 95 units.
|
Year |
Actual Demand |
|
2012 |
100 |
|
2013 |
120 |
|
2014 |
250 |
b) A project work consists of four jobs for which 4 contractors have submitted tenders. The tender amounts quoted in lakhs of rupees are given in the matrix form.
|
Job contractor |
I |
II |
III |
IV |
|
A |
10 |
16 |
12 |
9 |
|
B |
24 |
22 |
20 |
26 |
|
C |
30 |
28 |
32 |
34 |
|
D |
15 |
12 |
10 |
16 |
Find the assignment which minimizes the total cost of the project. (Initial feasible solution by VAM)
15. Using the following data, find the minimum transportation cost.
16. A firm takes two types of furniture, chairs and tables. The contribution(profit) for each product as calculated by the accounting department is Rs. 200 per chair and Rs.300 per table. Both products are processed on three machines M1. M2 and M3. The time requirement in hours by each product and total time available in hours per week on each machine are as follows.
|
Machine |
Chair |
Table |
Available Item |
|
M1 |
3 |
3 |
36 |
|
M2 |
5 |
2 |
50 |
|
M3 |
2 |
6 |
60 |
How should the manufacturer schedule his production in order to maximize the contribution (profit)? Use a graphical method.
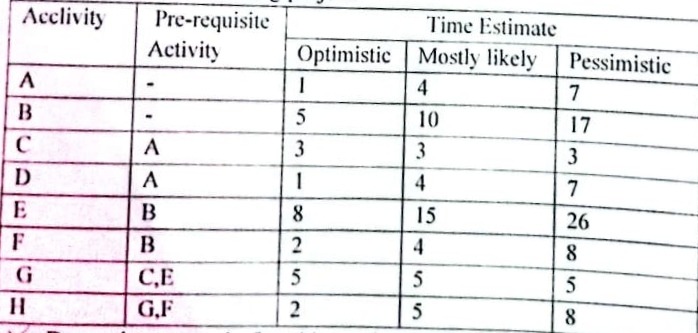
17. A small project composed of eight activities and their time estimates are as follows: Consider the following project.
a) Draw the network for this project and find the expected project completion time.
b) A project work consists of four jobs for which 4 contractors have submitted tenders. The tender amounts quoted in lakhs of rupees are given in the matrix from.
c) What is the probability that the project will be completed within 41 days.
d) What should be the scheduled completion time for the probability of completion to be 95%?
Section "C
Case Analysis [20]
18. Successful selling is as much an art as a science, but many sales managers believe that personal attributes are important in predicting sales success. Design Alley is a full service interior design store that sells custom blinds, carpets and wall coverings. The store manager, Mr. A, contracted with a sales force selection company to conduct a pre-hiring test on four aptitudes. Mr. A has collected sales growth data for 25 of the sales people who were hired, along with the scores from the four tests of aptitude: creativity. mechanical ability, abstract thinking, and mathematical calculation. Mr. A. generated the following Minitab output.
a) Write the regression equation for sales growth in terms of the four factors test. Also predict the sales growth when CREAT 12, MECH=14, ABST 18, and MATH = 30.
b) Find standard error of estimate.
c) How much variation in sales growth is explained by the aptitude tests?
d) At a significance level of 0.05, which of the aptitude tests are significant explanatory variables for sales growth?
e) Is the overall model significant as a whole?