
Published by: Zaya
Published date: 25 Jun 2021
Max Planck (1858-1947) was born in Kiel Germany and attended schools in Munich and Berlin. Planck was an early pioneer in the field of quantum physics. Around 1900 Planck developed the concept of a fundamental unit of energy, a quantum, to explain the spectral distribution of blackbody radiation. This idea of a basic quantum of energy is fundamental to the quantum mechanics of modern physics. Planck received a Nobel Prize for his work in the early development of quantum mechanics in 1918. Interestingly, Planck himself remained sceptical of practical applications for quantum theory for many years. In order to explain blackbody radiation, Planck proposed that atoms absorb and emit radiation in discrete quantities given by
E = nhf
where:
· n is an integer known as a quantum number
· f is the frequency of vibration of the molecule, and
· h is a constant, Planck’s constant.
Planck named these discrete units of energy quanta. The smallest discrete amount of energy radiated or absorbed by a system results from a change in the state whereby the quantum number, n, of the system changes by one.
In 1905 Albert Einstein (1879-1955) published a paper in which he used Planck’s quantization of energy principle to explain the photoelectric effect. The photoelectric effect involves the emission of electrons from certain materials when exposed to light and could not be explained by classical models. For this work, Einstein received the Nobel Prize in Physics in 1921.
Niels Bohr (1885-1962) used Planck’s ideas on the quantization of energy as a starting point in developing the modern theory for the hydrogen atom. Robert Millikan made the first measurement of Planck’s constant in 1916. The best current value for Planck’s constant is 6.62607554 x 10⁻³⁴ J · s.
In this experiment, you will use light-emitting diodes (LED’s) to measure Planck’s constant. You should be familiar with semiconductors and diodes from Modern Physics. To review: LED’s are semiconductors that emit electromagnetic radiation in optical and near optical frequencies when a voltage is applied to them. LED’s emit light only when the voltage is forward biased and above a minimum threshold value. This combination of conditions creates an electron-hole pair in a diode. Electron hole pairs are charge carriers and move when placed in electrical potential. Thus many electron-hole pairs produce a current when placed in an electric field. Above the three hold value, the current increases exponentially with voltage.
A quantum of energy is required to create an electron-hole pair and this energy is released when an electron and a hole recombine. In most diodes, this energy is absorbed by the semiconductor as heat, but in LED’s this quanta of energy produces a photon of discrete energy E = hf. Because multiple states may be excited by increasing the voltage across a diode, photons of increasing energies will be emitted with increasing voltage. Thus the light emitted by an LED may span a range of discrete wavelengths that decrease with increasing
voltage above the threshold voltage (shorter wavelength = higher energy). We are interested in the maximum wavelength that is determined by the minimum energy needed to just to create an electron-hole pair. It is numerically equal to the turn-on voltage of the LED. The relation between the maximum wavelength, l, and the turn-on voltage, V0, is
where:
· f is the frequency of the emitted photons,
· c is the velocity of light,
· e is the electronic charge, and
· h is Planck’s constant.
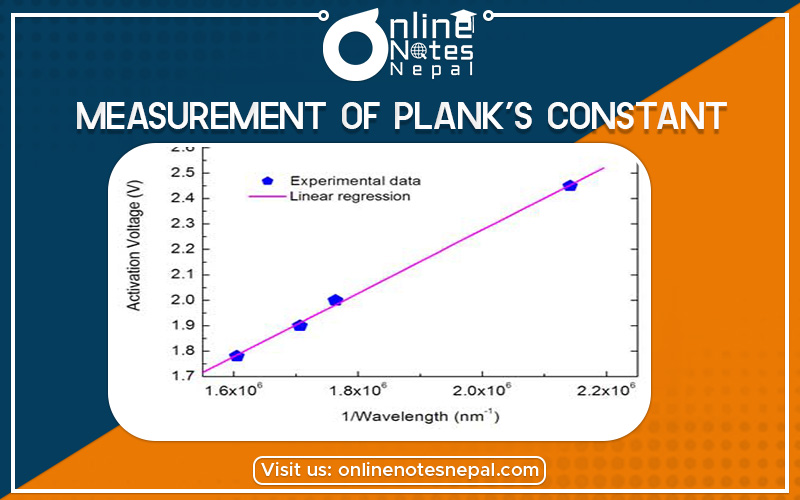
The maximum wavelength of the LED can be measured to a resolution of a few nanometers with a good spectrometer. If the turn-on voltage, V0, is measured for several diodes of different colours (and different maximum wavelength, l), a graph of V0 vs. 1/l should be linear with a slope of hc/e. The experimental value of Planck’s constant may then be determined by using the known values of the speed of light, c, and the charge of an electron, e, and computing h.
Measurement of plank’s constant.
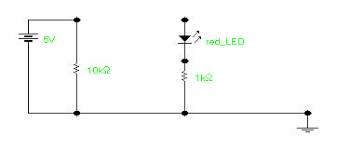
The circuit that will be used to experimentally determine Planck’s constant is illustrated below.
The A input to the 750 interface measures the voltage across the 1000 W resistor in series with the LED. This voltage is directly proportional to the current through the LED, and its value is numerically equal to the current in mA. The B input reads the total voltage across the LED and the 1000 W series resistor. The difference between these two voltages is the voltage across the LED. To perform the experiment, the voltage probes are connected to the first two analogue inputs of the 750 interface and the Pasco Data Studio program is used
to record the voltages as the potentiometer is turned from its minimum (fully counterclockwise) to its maximum (fully clockwise) position. In this way, thousands of data points may be acquired in a few seconds. After the data is collected, it is scanned to determine the least value at which the resistor voltage becomes nonzero. This is the turn-on voltage, V0, for that particular LED. By using different LED’s of a different colour (different maximum wavelength, l) and by measuring the corresponding value of V0, a table of data of V0 versus 1/l can be developed. A graph of V0 versus 1/l is plotted which has a slope of hc/e, from which h is determined. A typical graph of V0 versus 1/l for several LED’s is
shown below.
