Published by: Dikshya
Published date: 05 Jul 2023
The IS function, also known as the investment-saving function or the IS curve, represents the equilibrium condition in the product (goods) market within the IS-LM model. It shows the combinations of output (Y) and the interest rate (r) at which total investment equals total saving.
Mathematically, the IS function can be represented as:
Y = C(Y-T) + I(r) + G
where:
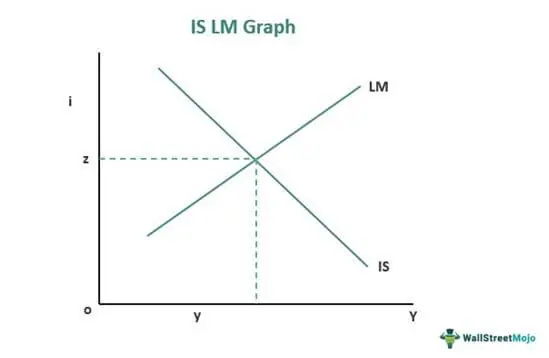
The IS curve shows the relationship between output (Y) and the interest rate (r) that ensures equilibrium in the product market. It slopes downward because a decrease in the interest rate stimulates investment, leading to an increase in output. Conversely, an increase in the interest rate reduces investment and decreases output. Changes in fiscal policy, such as government spending (G) or taxes (T), can shift the IS curve. For example, an increase in government spending or a decrease in taxes will shift the IS curve to the right, reflecting higher levels of output for a given interest rate.
The IS curve intersects with the LM curve (representing the equilibrium condition in the money market) to determine the overall equilibrium level of output and interest rate in the economy.
The LM function, also known as the liquidity-money function or the LM curve, represents the equilibrium condition in the money market within the IS-LM model. It shows the combinations of output (Y) and the interest rate (r) at which the demand for money equals the supply of money.
Mathematically, the LM function can be represented as:
M/P = L(r, Y)
where:
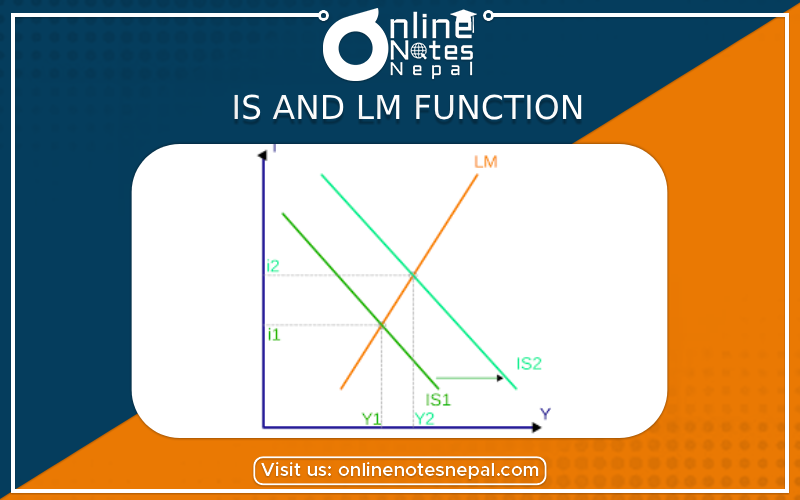
The LM curve shows the relationship between output (Y) and the interest rate (r) that ensures equilibrium in the money market. It slopes upward because an increase in output leads to an increased demand for money. To satisfy this increased demand, the interest rate must rise. Conversely, a decrease in output reduces the demand for money, requiring a lower interest rate to equate money demand and supply. Changes in the money supply (M) or shifts in the demand for money (L(r, Y)) can shift the LM curve. For example, an increase in the money supply or a decrease in the demand for money will shift the LM curve to the right, reflecting lower interest rates for a given level of output.
The intersection of the LM curve and the IS curve determines the overall equilibrium level of output and interest rate in the economy, representing the general equilibrium of the product and money markets in the IS-LM model.