
Published by: Zaya
Published date: 16 Jun 2021
Profit maximization of a firm TR-TC approach. The price and output determination under TR and TC approach is explained below:-
The profit maximization level of output can be shown with the help of the following diagram:
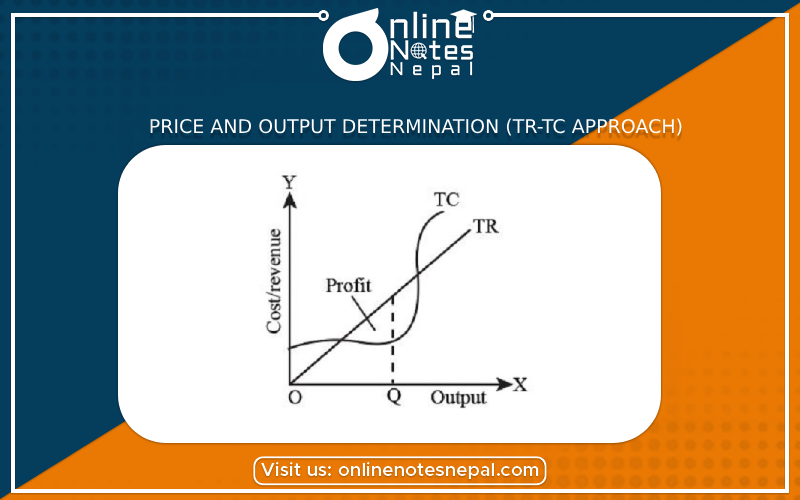
In the above figure, we measure the cost revenue on the y-axis and output on the x-axis respectively.
The line TR increases proportionately to the increase in output sales. TC is inverse S-shaped. It shows the operation of the law of diminishing returns, in the production process.
The maximum level of profit and output is determined by drawing a tangent to the S-shaped TC curve. The vertical distance between Total revenue and total cost measures the maximum level of per-unit profit.
Total profit= per unit profit × quantity sold
Imperfect Competition – Where there is a maximum difference between TR and TC, the output is determined. Characteristics are:-
2. Monopolistic Market
3. Oligopoly
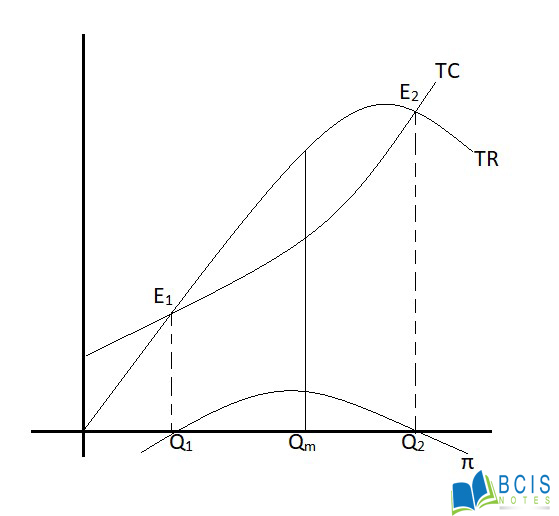
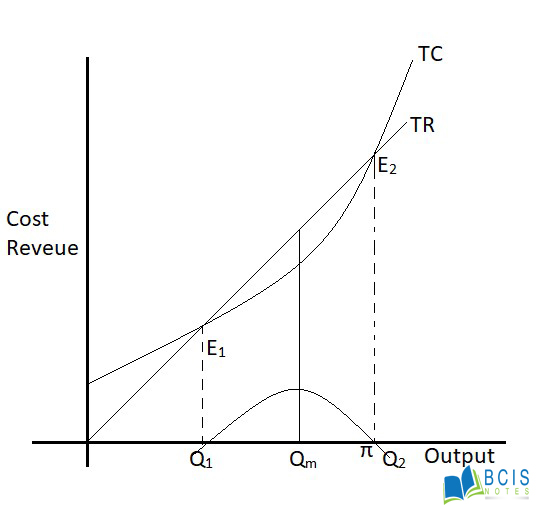
The profit curve is drawn by measuring the gap between total revenue and total cost curves. The maximum profit Qm. Before Q1 and Q2, the profit curve lies below the x-axis which represents that there is a loss to the firm. The maximum profit is at the output Qm. Thus Q2 is the equilibrium output level of the firm.
Therefore the Price and output determination (TR-TC Approach) is explained above.