
Published by: Zaya
Published date: 15 Jun 2021
A measurement of responsiveness of quantity demanded due to a change in income of the commodity is called income elasticity of demand. It is connected with normal goods and inferior goods.
i.e. Ey or ey = Percentage change in quantity demanded ÷ Percentage change in income
OR, %∆Qd÷∆y
There are three types of Income elasticity is of three:
If the demand for a commodity varies inversely with income, income elasticity will be negative. It is connected with inferior goods.
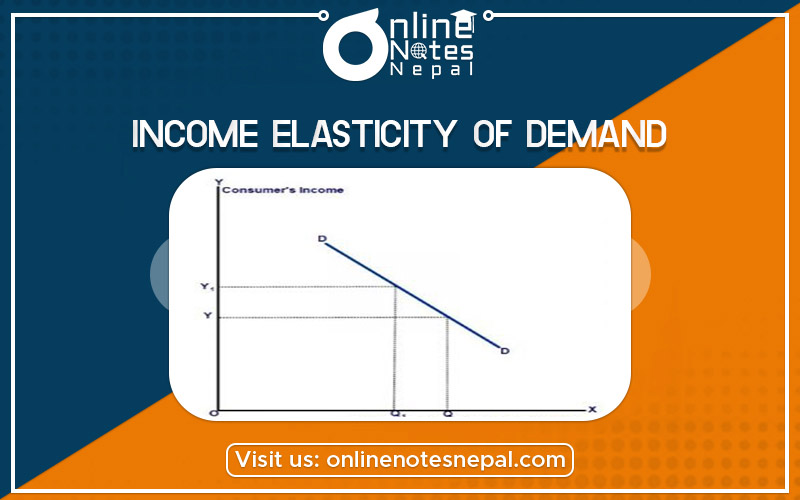
Based on the figure let, initial income and quantity are OY1 and OQ1, respectively. When income falls from OY1 to OY2 demand raises from OQ1 to OQ2. It implies that demand varies inversely with income. Thus, curve DD4 is sloping downward from left to right is negative.
If the increase in income leads to an increase in demand for a commodity and a decrease in income leads to a decrease in demand for a commodity, it is called positive income elasticity.
The commodities which have a positive income elasticity of demand are called normal goods. It has three degrees or value which are described below:
i. Greater than unity (ey > 1): If the percentage or proportionate change in demand for a commodity is greater than the percentage change in income, it will be greater than one.
ii. Equal to unity (ey > 0): If the percentage or proportionate change in demand for a commodity is equal to the percentage change in income, income elasticity will be equal to unity.
iii. Less than unity (ey < 1): If the percentage or proportionate change in demand for a commodity is less than the percentage change in income, it will be less than one.
If there is no response in demand due to the change in income, it will be zero. It is connected with very low-priced items.
According to the figure, QD5 is the demand curve sloping vertical straight line. This slope indicates that whatever be the change in income demand remains constant. Thus, the QD5 demand curve is zero.