Published by: Zaya
Published date: 16 Jun 2021

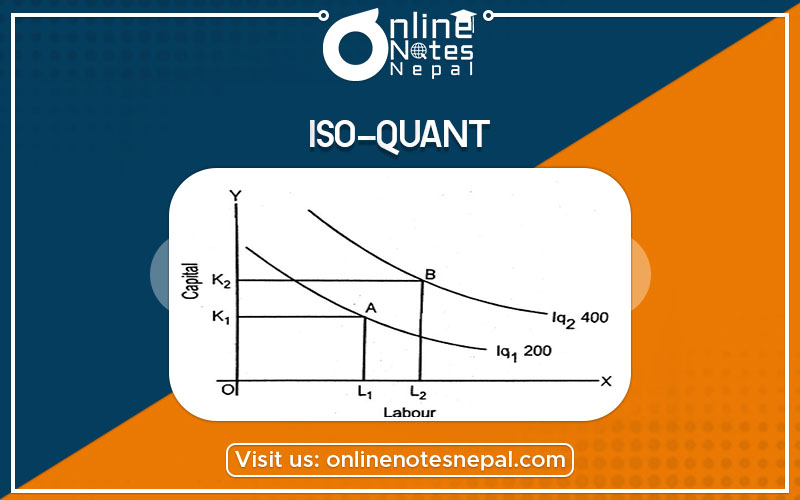
An iso-quant curve is a locus representing different combinations of two inputs that yield the same level of output to the producer. It slopes downwards to the right as a rectangular hyperbola and this is because of the diminishing marginal rate of technical substitution. It is the geometric representation of the production function. The same level of output can be produced by various combinations of factor inputs.
Iso-Quant map
The production function describes not only a single isoquant, but the whole array of isoquants, each of which shows a different level of output. It shows how output, X, varies as the factor inputs (L, K) change. It is called an iso-quant map. A higher isoquant refers to a larger output, while a lower isoquant refers to a smaller output (X). IQ map is a set of iso-quants. It shows the producer’s preferences.
MRTS is a rate at which units of two inputs are substituted with each other to maintain the same level of output. The Marginal Rate of Technical Substitution of K for L is defined as the amount of K, the producer can give up to get one more unit of L and maintain the same level of Output.
| Combination | Labor | Capital | MRTS |
| A | 1 | 12 | — |
| B | 2 | 8 | 4:1 |
| C | 3 | 5 | 3:1 |
| D | 4 | 3 | 2:1 |
| E | 5 | 2 | 1:1 |
In the above table, we can see that for getting every additional unit of Labor, the producer will give up less and less Capital, i.e., 4:1, 3:1, 2:1, 1:1 respectively. This is the Law of Diminishing MRTS.
In the above figure, we measure labor (L) and Capita(K) in the x-axis and y-axis respectively.
MRTS is measured by the slope of the Isoquant i.e.
The slope of IQ = MRTS