
Published by: Zaya
Published date: 15 Jun 2021
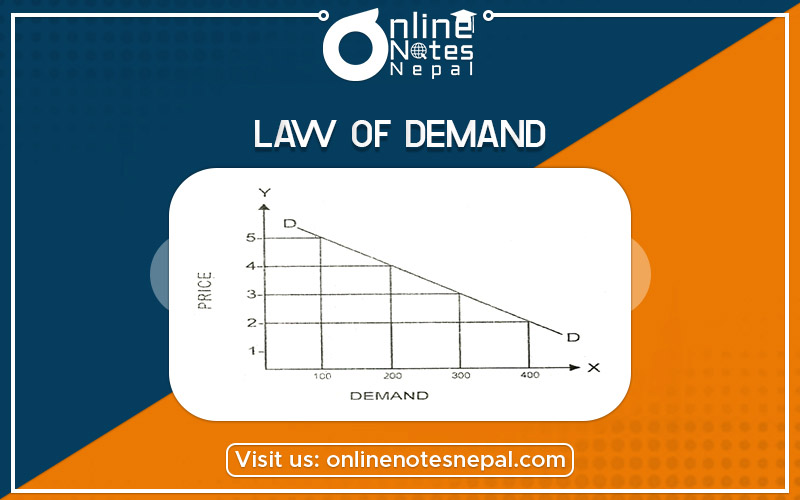
The Law of demand states that other things being equal, demand for a commodity varies inversely with the price of the same commodity. This statement clearly states that there is an inverse relationship between the price of a commodity and the demand for the same commodity. As the price rises demand for the commodity will fall, as price falls demand for the commodity will rises. In other words, the higher the price, the lower the quantity demand of a commodity and vise-Versa.
The demand schedule is the tabular statement that represents the inverse relationship between the price of the commodity and the quantity demanded.
| S.N | Price of a Commodity | Quantity Demanded |
|
1. 2. 3. 4. 5.
|
5 10 15 20 25 |
25 20 15 10 5 |
The demand curve is a graphical relationship between a commodity at different price levels and quantities that consumers are willing to buy. The curve can be derived from a demanding schedule, which is essentially a table view of the price and quantity pairings that comprise the demand curve.

This law is based on the following assumptions:
1. No change in taste, preferences, and fashion of the consumer.
2. No change in the level of the income of the consumer.
3. The prices of related goods remain fixed.
4. The size of the population is fixed.
5. No change in advertisement expenditure.
| Movement in demand curve or change in the quantity of demand | The shift in the demand curve or change in demand |
| This is due to the change in price determinant of demand. | This is due to change other than price determinants of demand. |
| It holds ‘ceteris paribus’ assumption. | It doesn’t hold ‘ceteris paribus’ assumption. Here the price is constant. |
| No price effect. | The price effect is negative. |
|
Types: -contraction -Expansion |
Types:-Decrease -Increase |
| It can be shown by the single demand curve. | It can be shown by multiple demand curves. |
| Example:- Price | Example:- Income, Price of related goods, etc. |