
Published by: Sareena Kumari Basnet
Published date: 23 Jul 2024

The ER model defines the conceptual view of a database. It works around real-world entities and the associations among them. At view level, the ER model is considered a good option for designing databases.
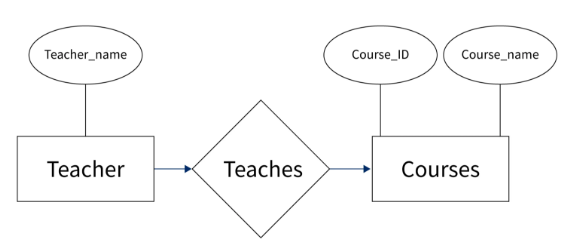
Entity Relationship Diagram, also known as ERD, ER Diagram or ER model, is a type of structural diagram for use in database design. An ERD contains different symbols and connectors that visualize two important information: The major entities within the system scope, and the inter-relationships among these entities.
Sample E-R Diagram
Components of a ER Diagram

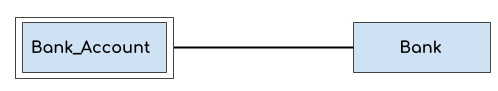
An entity is an object or component of data. An entity is represented as rectangle in an ER diagram.
For example: In the following ER diagram we have two entities Student and College and these two entities have many to one relationship as many student's study in a single college.

Weak Entity:
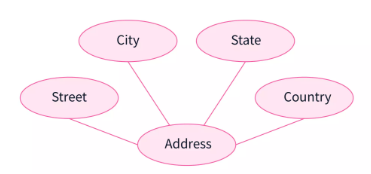
An attribute describes the property of an entity. An attribute is represented as Oval in an ER diagram. There are four types of attributes:
a) Key attribute

b) Composite attribute
c) Multivalued attribute

d) Derived attribute

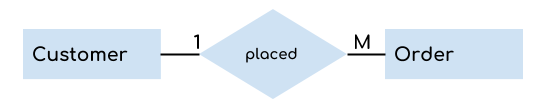
A relationship is represented by diamond shape in ER diagram, it shows the relationship among entities. There are four types of relationships:
a) One to One

b) One to Many
c) Many to One

d) Many to Many
