Published by: Sayuja Koirala
Published date: 28 Jul 2024

The production possibility Curve is a graphical representation maximum level of output that an economy can achieve with the maximum utilization of available resources. PPC is a graph that shows various combinations of the amount of two commodities that an economy can produce per unit of time such as the number of shoes versus kilograms of butter.
Assumptions:
1) Only two goods are produced in an economy.
2) The factor of production is fixed.
3) There is full employment of resources.
4) Production Technology is given and constant.
5) Time-period is given.
Production Possibility Curve Table
| Combination | Consumer goods (Rice) |
Capital goods (Wheat) | Opportunity cost |
| A | 0 | 15 | 0 |
| B | 1 | 14 | 1 |
| C | 2 | 12 | 2 |
| D | 3 | 9 | 3 |
| E | 4 | 5 | 4 |
| F | 5 | 0 | 5 |
Production Possibility Curve Diagram

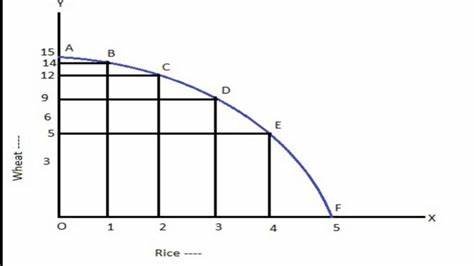
In the above table and diagram, there are different possibilities with factor combinations A, B, C, D, E and F. When all the resources are employed to produce Rice, then no wheat can be produced in possibility A. When 1 kg of rice is produced, then only 9 kg of wheat can be produced and so on.
When all the possibilities are connected, then we get a concave nature of the curve which is known as the Production Possibility Curve. Points E and F are inefficient points because they are unattainable due to limited resources and given technology. To produce at this point, the economy requires more resources or improved technology.